

すべてのダイレクトマーケティングの課題を解決する
すべてのダイレクトマーケティングの課題を解決する
Services
テレビ、新聞、デジタルを
トータルサポート


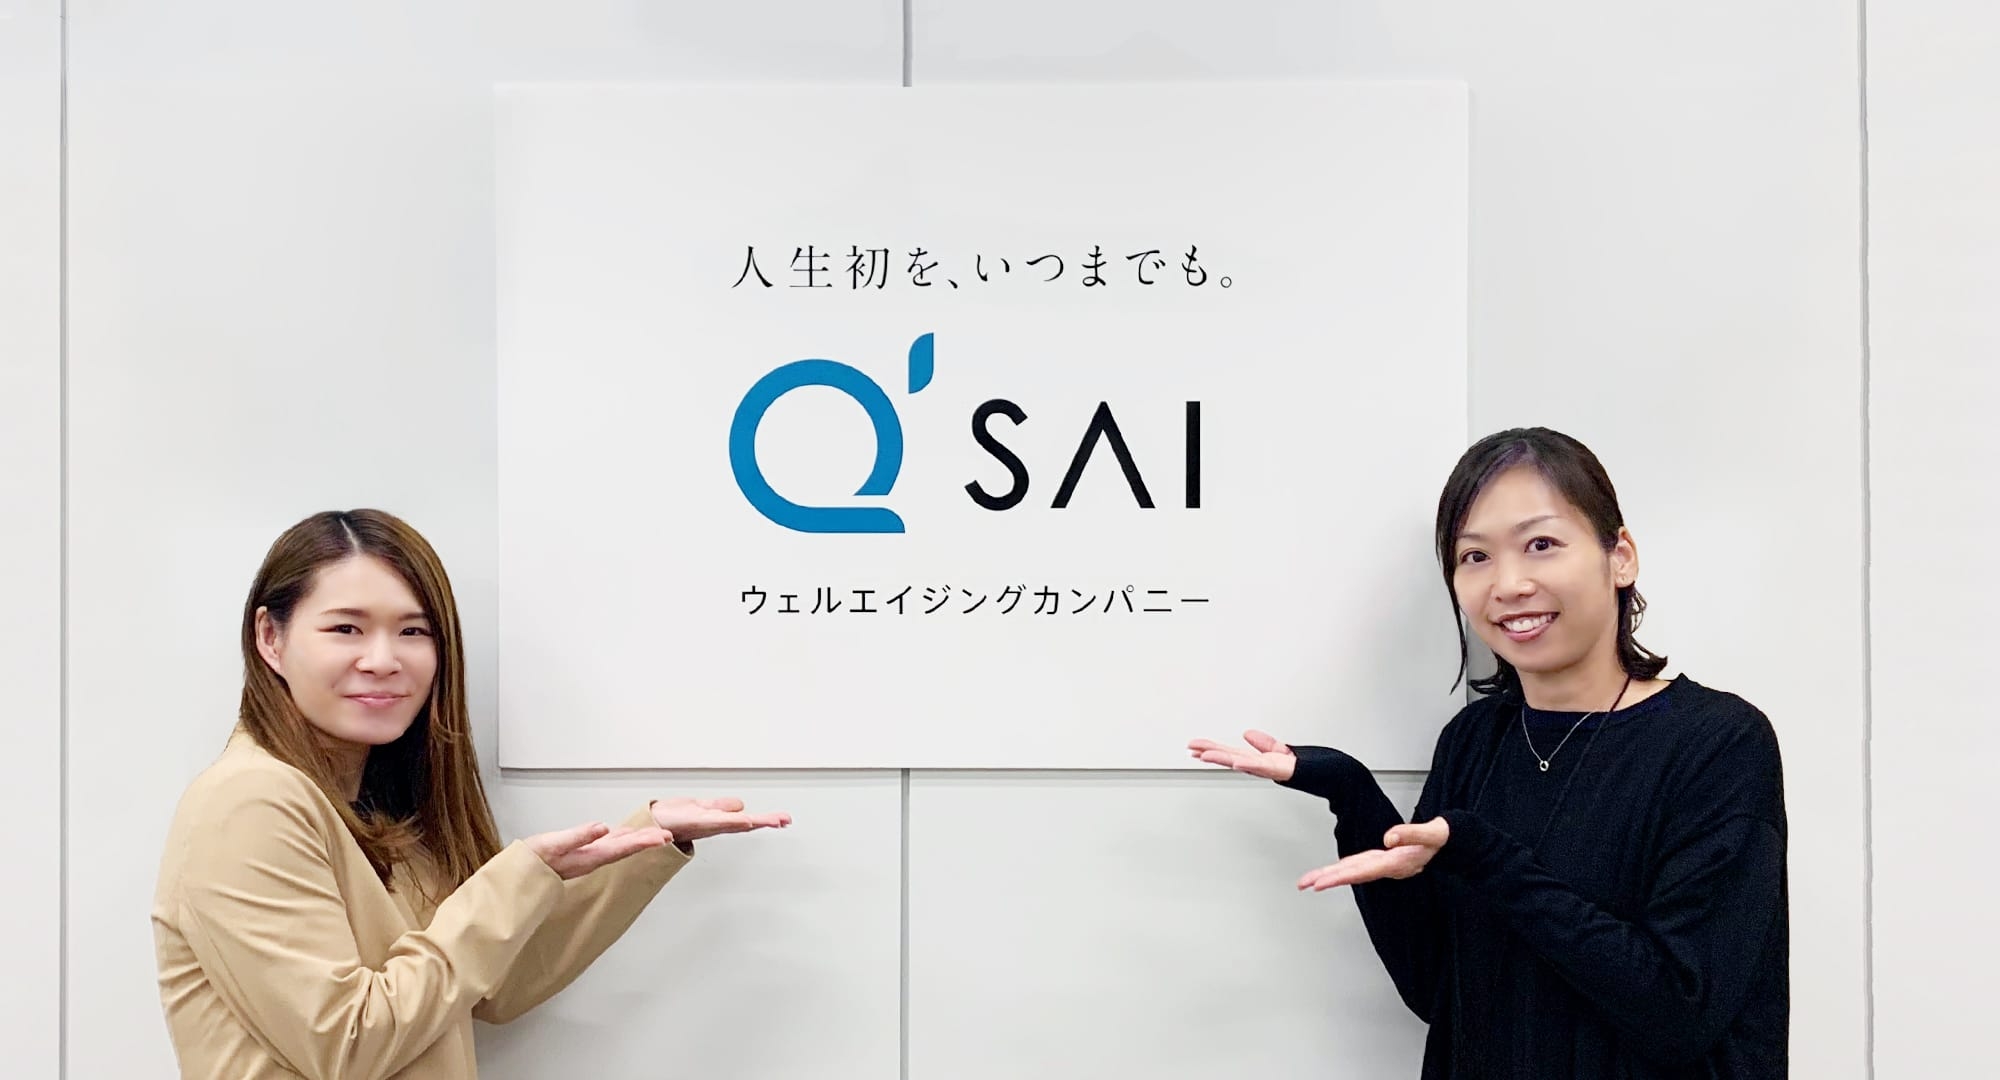
Case study
支援実績・サポート企業インタビュー


Topic
News
-
【3月8日17:35~登壇】直販・通販事業に携わるトップマーケッターが集結する「ダイレクトアジェンダ2024」に出展します
-
九州支店移転のお知らせ
-
【12月8日開催】執行役員 谷本が、デジタルメディアとマーケティング業界の有識者が一堂に会するカンファレンス「ATS Tokyo 2023」に登壇(ATS Tokyo 2023 サイトへリンク)
-
グランドビジョン共催セミナーを開催しました:セミナータイトル「ブランディングCRM:CPO高騰の壁を越え、通販事業を成功させるクリエイティビティとは?」
-
執行役員 谷本が、ad:tech tokyo 2023へ公式スピーカーとして登壇します。参加セッション:10月20日(金)[DT-8] 進化するアドフラウドとブランドリスクへの対処法( ad:tech tokyo サイトへリンク)
-
ExchangeWire JAPANに、弊社執行役員 谷本秀吉の記事が掲載されました。|アドテク業界の古豪、テレビとデジタルを融合し新しいダイレクトマーケティングの設計に挑戦[インタビュー]
-
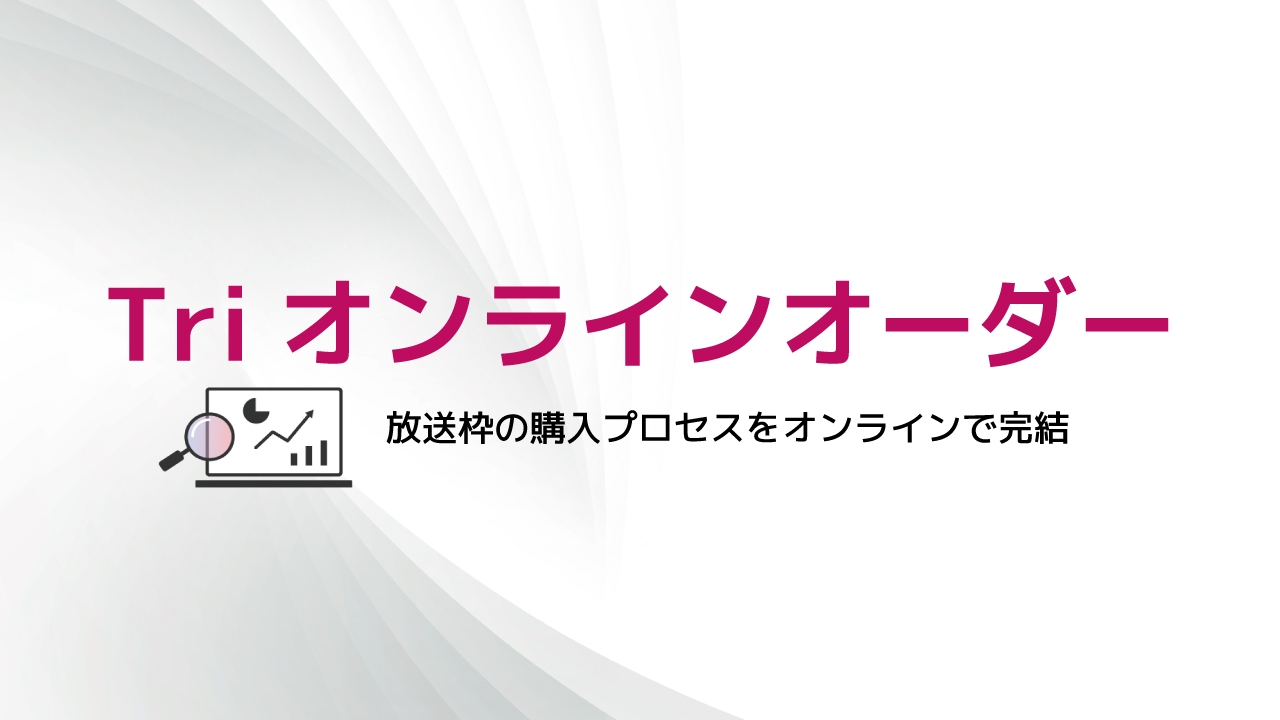
通販新聞に「ソクレス」に関する記事が掲載されました:トライステージ、テレビ広告枠販売の会員制オンラインサービスの利用順調 長尺・短尺枠やラジオ枠を取り扱い
-
日経電子版に「Tri-DDM」について掲載されました
-
元メジャーリーグ投手 斎藤 隆氏による経営者へのインタビュー企画 『“社員力”で勝ち抜く経営のヒント』(「経営力向上ラボ」サイト連載)に 日本百貨店社長の鈴木 正晴が出演しました
-
日経電子版、日経MJに、アストロとの業務提携について掲載されました